

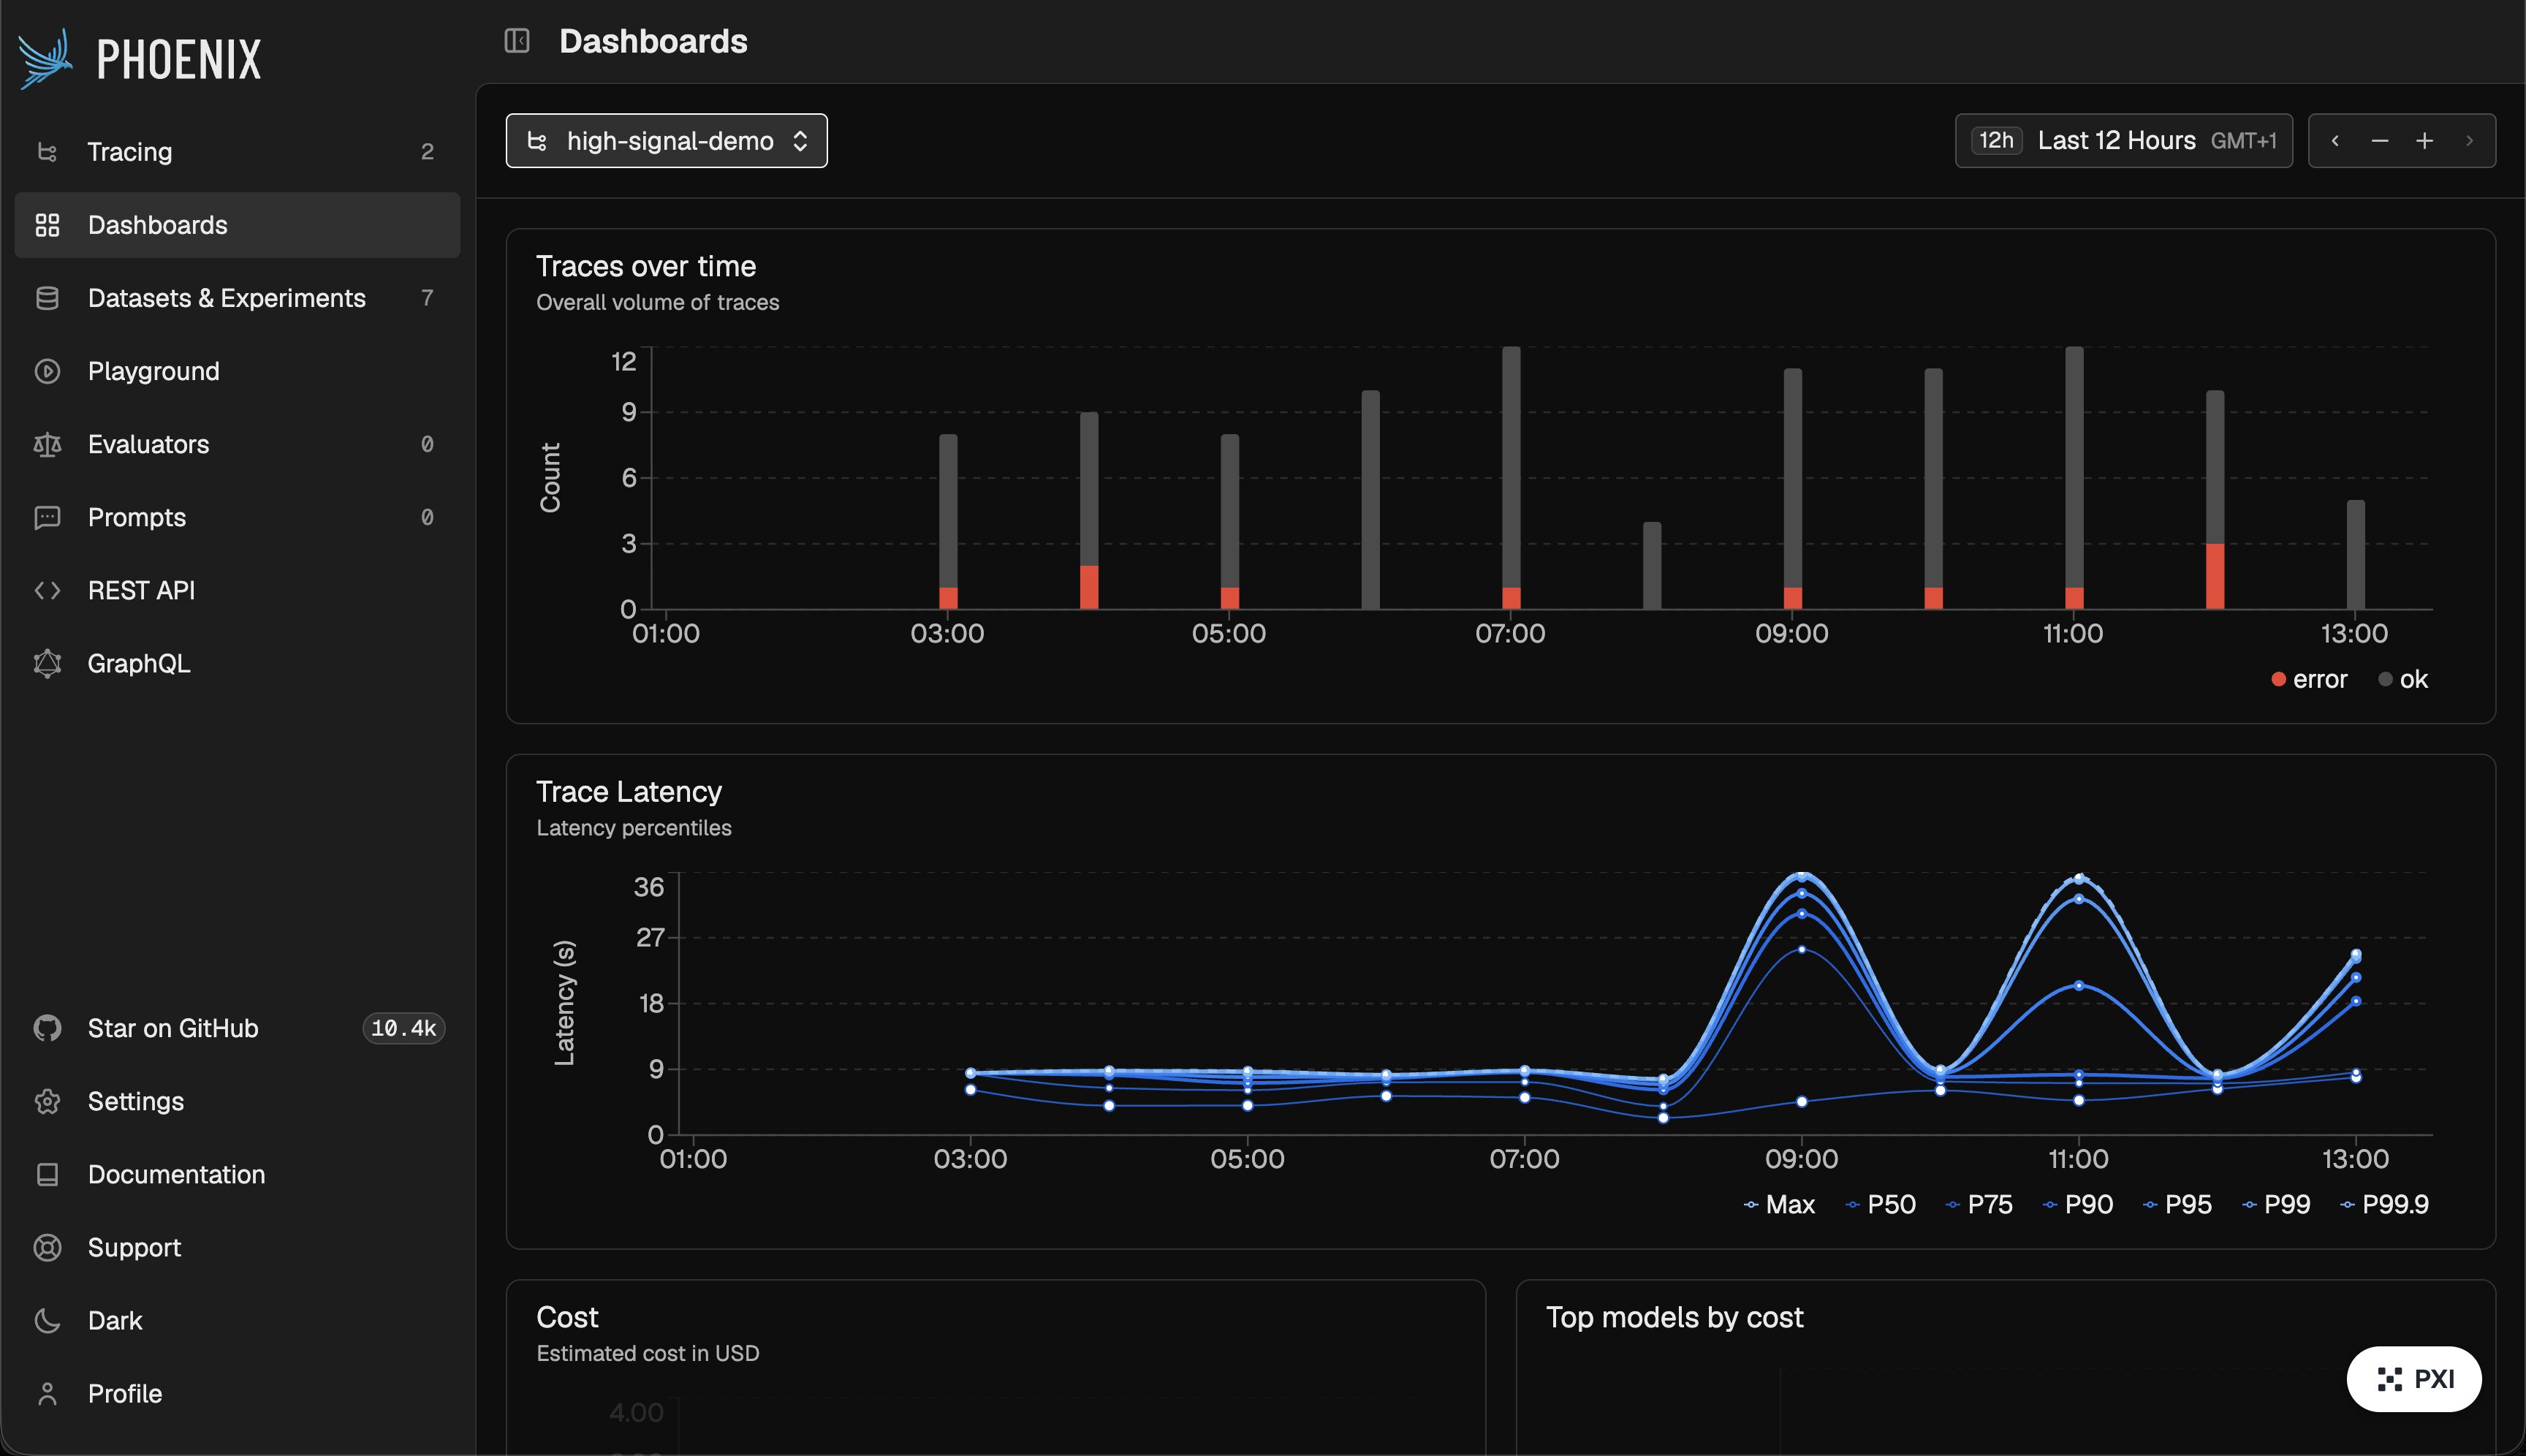
The pre-defined metrics dashboard for a Phoenix project
- Traces over time
- Trace Latency percentiles
- Cost estimated in USD
- Top models by cost
- Top models by tokens
- Token usage by prompt and completion
- Prompt token details by input, cache, and audio parts
- Completion token details including output, reasoning, and audio parts
- LLM span counts over time
- LLM spans with errors over time
- Tool span counts over time
- Tool spans with errors over time
- Average Span annotation scores
- Average trace annotation scores
- Average session annotation scores
If you need custom alerting and dashboards on top of your trace data, including metrics tailored for non-developer stakeholders, Arize AX’s Dashboards supports these additional features.
Next Steps
Setup Projects
Organize traces into separate projects
Cost Tracking
Monitor token usage and LLM costs
Log Annotations
Add scores, labels, and LLM evals to your traces